
Visualise you Tunes with Code
Coding
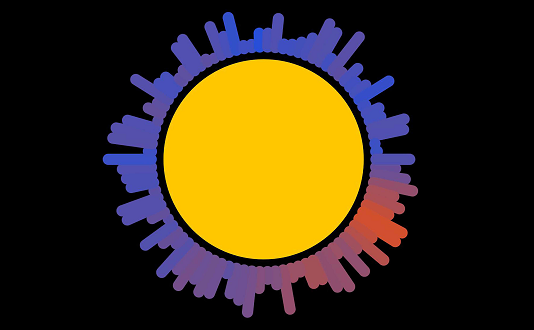
Table of Contents
Capturing Sound with the Microphone
Open up the following P5 sketch:
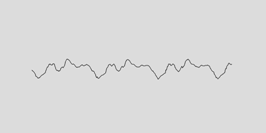
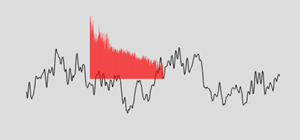
Starter SketchThe above sketch captures sound from your microphone and turns it into digital data. This data is then turned into a wave.
Run the code. You should be able to make squiggles by speaking or singing:
Take a look at the code and try to understand how it works:
let sv

function setup() {
let canvas = createCanvas(600, 600)

  // Create a sound visualiser
  sv = new soundVisualiser()

  // Turn on the microphone input
  sv.enableMicrophone()
}

function draw() {
  // Analyse the sound being played
  sv.analyseSound()

  // Set the background colour
  background(220)
  // Draw the wave
  sv.wave(300, 300, 200, 100)
}
Visualising Frequencies
Add the the following lines after the call to the wave() function in sketch.js:
function draw() {
  // Analyse the sound being played
  sv.analyseSound()

  // Set the background colour
  background(220)

  // Draw the wave
  sv.wave(300, 300, 200, 100)

  // Draw the frequency chart
  sv.frequencyChart(200, 300, 200, 100)
}
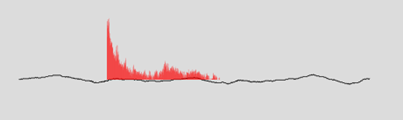
Run the sketch. You should now see the frequency chart when you speak or sing.
Add Code to Play the Music File
Take a look at the files in the P5 sketch:
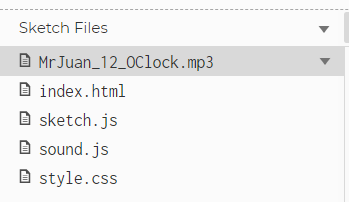
You will see a music file called MrJuan_12_OCLock.mp3 (shared under Creative Commons Licence see https://freemusicarchive.org/music/MrJuan)
We are going to stop listening to the microphone and instead listen to this track. First comment out the enableMicrophone line by placing // in front of it:
function setup() {
  let canvas = createCanvas(600, 600)

  // Create a sound visualiser
  sv = new soundVisualiser()

  // Turn on the microphone input
  // sv.enableMicrophone()

}
Then add a line to play the track when the canvas is clicked with the mouse:
function setup() {
  let canvas = createCanvas(600, 600)

  // Handle the mouse click event
  canvas.mouseClicked(togglePlay)

  // Create a sound visualiser
  sv = new soundVisualiser()

  // Turn on the microphone input
  // sv.enableMicrophone()
}
Now add these two new functions to the end of the sketch:
function preload() {
  sound = loadSound('MrJuan_12_OClock.mp3')
}
function togglePlay() {
  // Turn the music on or off
  if (sound.isPlaying()) {
    sound.pause()
  } else {
    sound.loop()
  }
}
Run the sketch. You should now see the charts moving in time to the music.
A Nicer Frequency Chart
Comment out the call to FrequencyChart(). Add a call to frequencyBars():
function draw() {
// Analyse the sound being played
sv.analyseSound()
// Set the background colour
background(220)
// Draw the wave
sv.wave(300, 300, 200, 100)
// Draw the frequency chart
//sv.frequencyChart(200, 300, 200, 100)
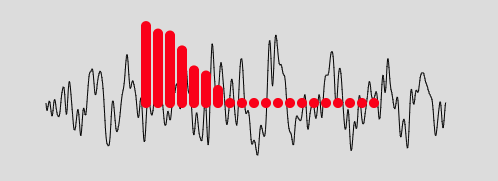
sv.frequencyBars(200, 300, {numBars:20})
}
You should see something like this:
You can also change the colour:
sv.frequencyBars(200, 300, {numBars:20, colour:color(60, 200, 60)})

Experiment with different colours and different numbers of bars.
Twist it into a Circle
Comment out the call to frequencyBars(). Use this line of code to twist the bars around a circle:
function draw() {
// Analyse the sound being played
sv.analyseSound()
// Set the background colour
background(220)
// Draw the wave
sv.wave(300, 300, 200, 100)
// Draw the frequency chart
//sv.frequencyChart(200, 300, 200, 100)
//sv.frequencyBars(200, 300, {numBars:20})
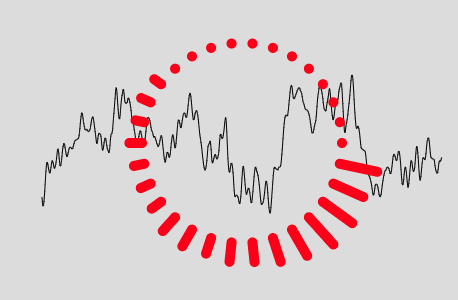
sv.frequencyRadial(300, 300, {radius:100, numBars:30, barWidth:10, barHeight:50, colour:color("red")})
}
You should see something like this:
Try out these ideas:
Experiment with the different parameters to see what you can create.
Try creating different radial charts around the screen.
Energy Circles
We can pick up the energy of the sound wave at different frequencies and use it to animate a shape.
Add the following lines of code:
function draw() {
  // Analyse the sound being played
  sv.analyseSound()

  // Set the background colour
  background(220)

  // Draw the wave
  sv.wave(300, 300, 200, 100)

  // Draw the frequency chart
  //sv.frequencyChart(200, 300, 200, 100)
  //sv.frequencyBars(200, 300, {numBars:20})
  sv.frequencyRadial(300, 300, {radius:100, numBars:30, barWidth:10, barHeight:50, colour:color("red")})

  sv.energyCircle(300,300, {energy:"bass", radius:100, fillColour:color("yellow"), strokeColour:color("yellow")})
  sv.energyCircle(300,300, {energy:"treble", radius:80, fillColour:color("green"), strokeColour:color("green")})
}
The yellow circle represents the bass (low notes), the green circle the treble (high notes). You can set the energy to any of these values:
bass, lowMid, mid, highMid, treble, all
Here are some things to try:
Experiment with different energies, sizes and colours.
Create multiple circles.
Create multiple circles.
Cats!
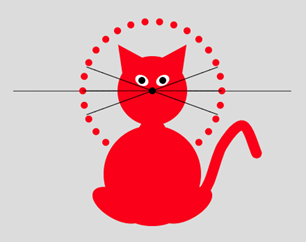
You can get quite creative with different shapes. The following function will draw a cat:
sv.cat(300, 300, 1)
To get it to move to the music, we need to tell it how to dance! To do that we can pass in some parameters:
sv.cat(300, 300, 1,
         {mouthHeight:30 * sv.energyAll,
          tailWag:30 * sv.energyAll,
          whiskerWaveHeight:30,
          bodyColour:color(231, 122,122)
          })
Cat Parameters
These are all the cat parameters you can change (with their default values):
| Parameter | Default Value |
|---|---|
| earWidth | 50 |
| headSize | 100 |
| noseSize | 10 |
| eyeW | 20 |
| eyeH | 15 |
| eyeRotation | 30 |
| eyePupilOffset | 0 |
| bodySize | 140 |
| tailWag | 0 |
| legW | 80 |
| legH | 40 |
| legRotation | 30 |
| mouthHeight | 0 |
| whiskerLength | 100 |
| whiskerWaveHeight | 0 |
| bodyColour | color(255, 0, 0) |
| eyeColour | color(255, 255, 255) |
| mouthColour | color(0,0,0) |
Here are some ideas for you to try:
Create a lead cat and backing group, with the backing group singing different frequencies.
Try changing colours in time to the music.
Make the eyes wiggle.
Make the cats move side-to-side
Create a lead cat and backing group, with the backing group singing different frequencies.
Try changing colours in time to the music.
Make the eyes wiggle.
Make the cats move side-to-side
Table of Contents
©2025 - Think Create Learn Ltd